You’ll probably get a lot of mileage out of your automated tests if you run things from your computer, look at the results, and tell people when there are issues in the application. But that only helps you solve part of the problem.
The real goal in test automation is to find issues reliably, quickly, and automatically – and ideally, in sync with the development workflow you’re a part of.
To do that we need to use a Continuous Integration server.
A Continuous Integration Server Primer
A Continuous Integration server (a.k.a. CI) is responsible for merging code that is actively being developed into a central place (e.g., “trunk” or “master”) frequently (e.g., several times a day, or on every code commit, etc.) to find issues early so they can be addressed quickly — all for the sake of releasing working software in a timely fashion.
With CI, we can automate our test runs so they can happen as part of the development workflow. The lion’s share of tests that are typically run on a CI Server are unit (and potentially integration) tests. But we can very easily add in our recently written Selenium tests.
There are numerous CI Servers available for use today, most notably:
- Bamboo
- Jenkins
- Solano Labs
- TravisCI
- etc.
Let’s step through an example of using Jenkins on CloudBees.
An Example
Jenkins is a fully functional, widely adopted, and open-source CI adn CD (Contibuous Delivery) server. Its a great candidate for us to step through. And DEV@cloud is an enterprise-grade hosted Jenkins service offered by CloudBees, the enterprise Jenkins company. It takes the infrastructure overhead out of the equation for us.
1. Quick Setup
We’ll first need to create a free trial account, which we can do here.
Once logged in we can click on Get Started with Builds from the account page. This will take us to our Jenkins server. We can also get to the server by visiting http://your-username.ci.cloudbees.com. Give it a minute to provision, when it’s done, you’ll be presented with a welcome screen.
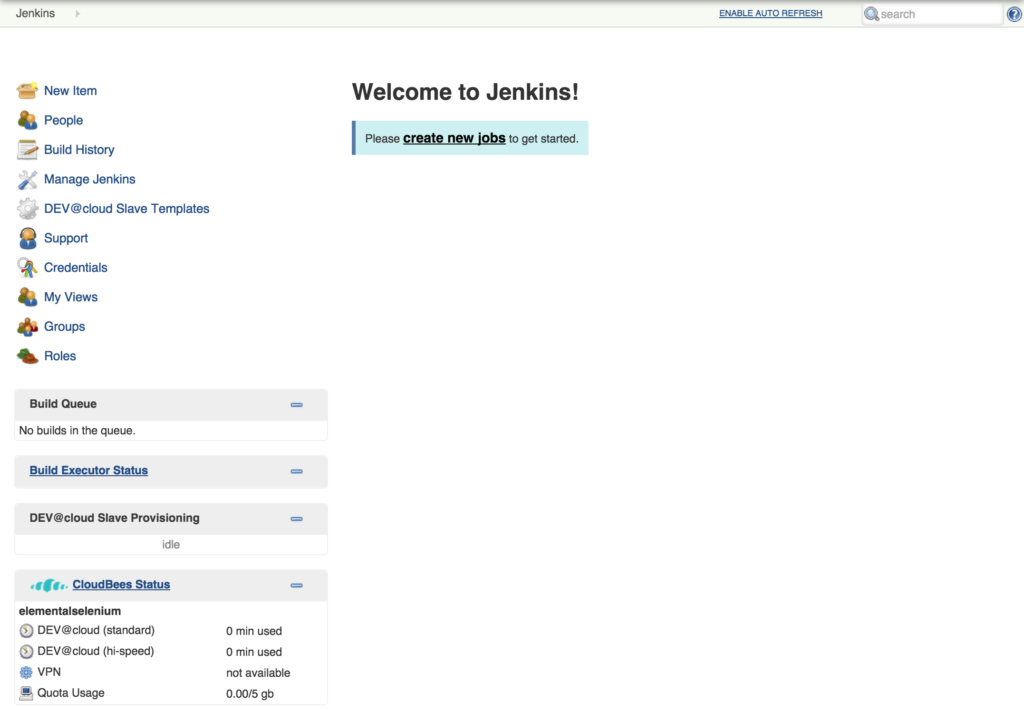
NOTE: Before moving on, click the ENABLE AUTO-REFRESH link at the top right-hand side of the page. Otherwise you’ll need to manually refresh the page to see results (e.g., when running a job and waiting for results to appear).
2. Create A Job
Now that Jenkins is loaded, let’s create a Job and configure it to run our tests.
- Click
New Itemfrom the top-left of the Dashboard - Give it a descriptive name (e.g.,
Login Tests IE8) - Select
Freestyle project - Click
OK
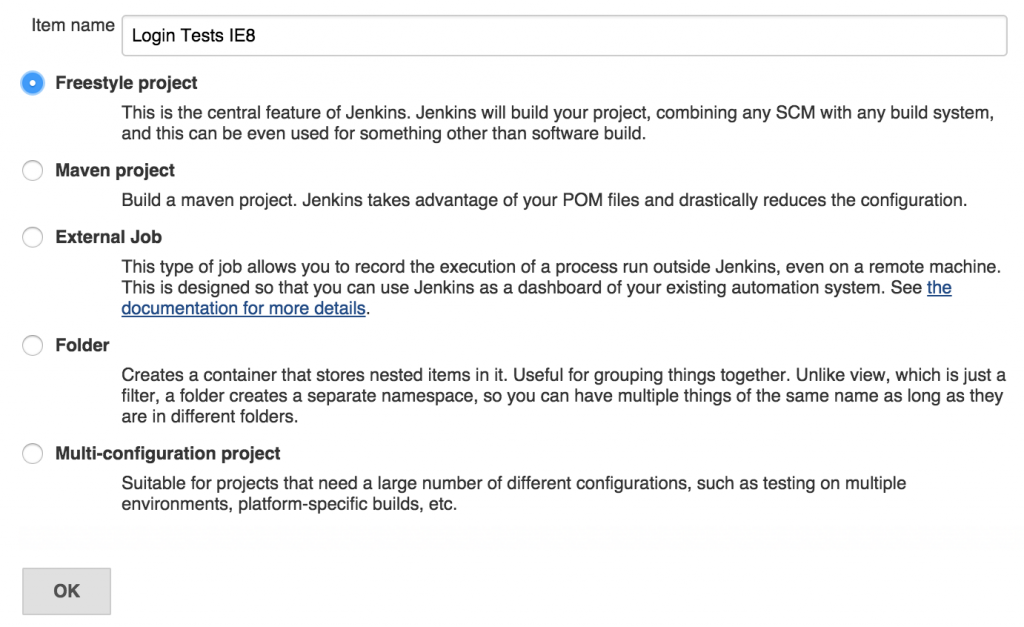
This will load a configuration screen for the Jenkins job.
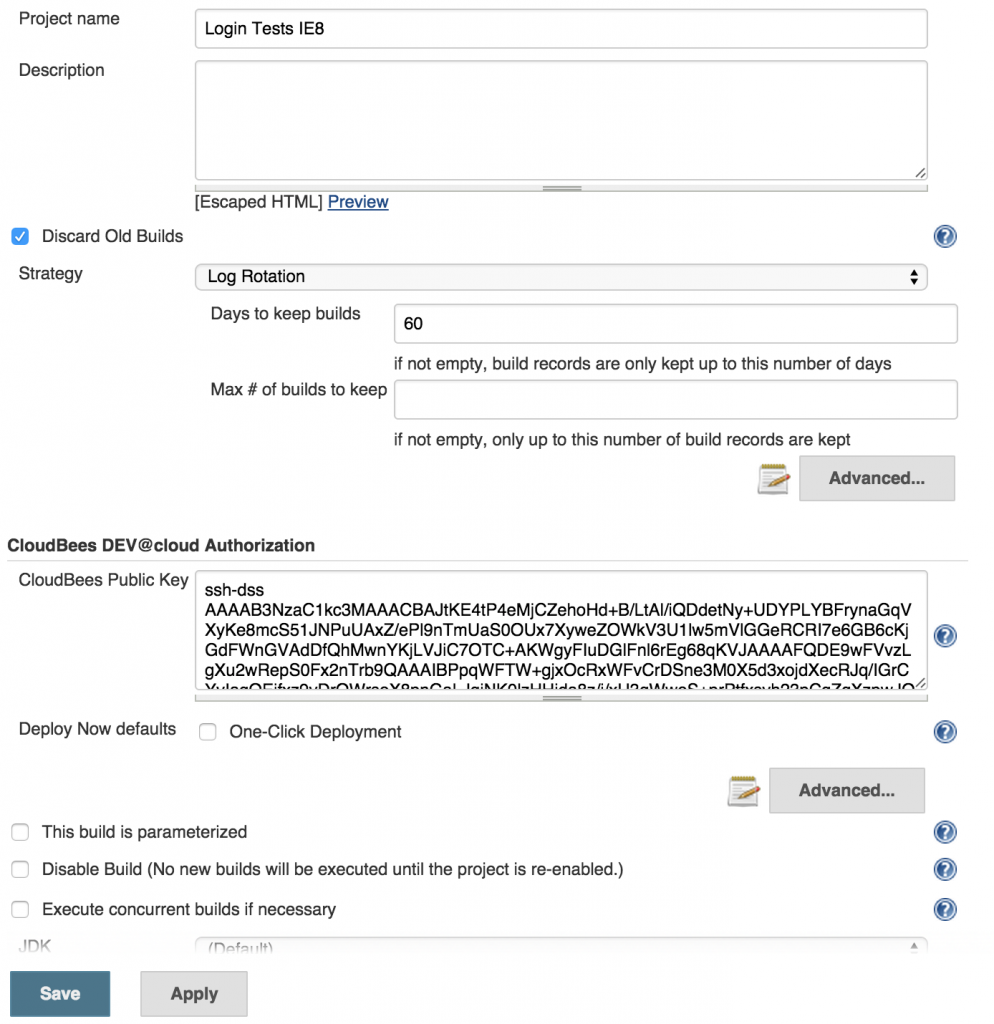
3. Pull In Your Test Code
Ideally your test will live in a version control system (like Git). There are many benefits to doing this, but the immediate one is that you can configure your job (under Source Code Management) to pull in the test code from the version control repository and run it.
- Scroll down to the
Source Code Managementsection - Select the
Gitoption - Input the Repository URL (e.g.,
https://github.com/tourdedave/getting-started-blog-series.git)
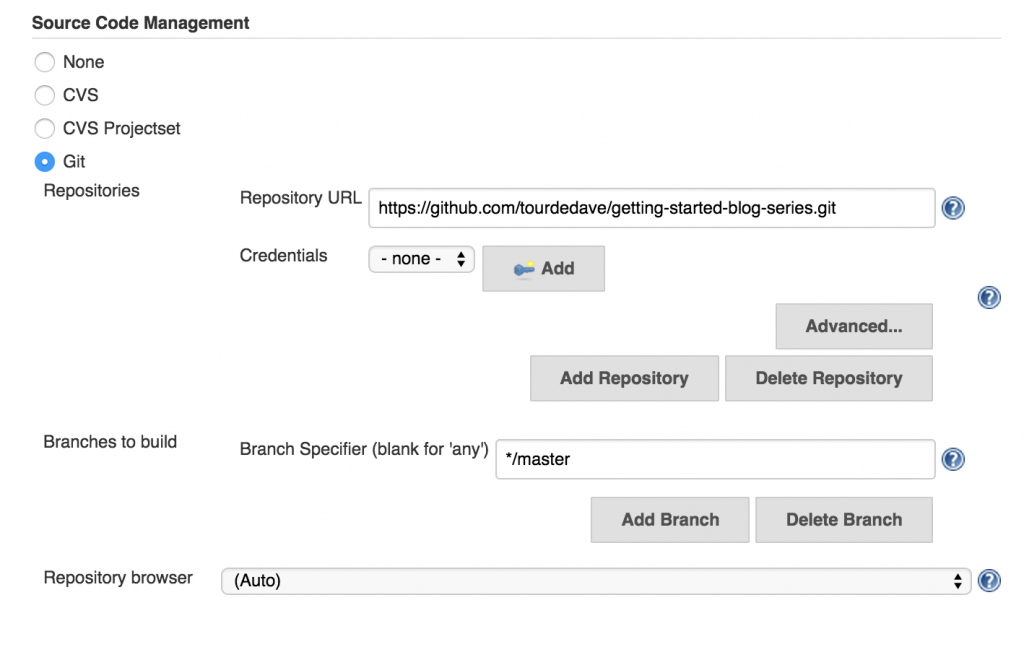
Now we’re ready to tell the Jenkins Job how to run our tests.
4. Add Build Execution Commands
- Scroll down to the
Buildsection - Click on
Add Build Stepand selectExecute Shell
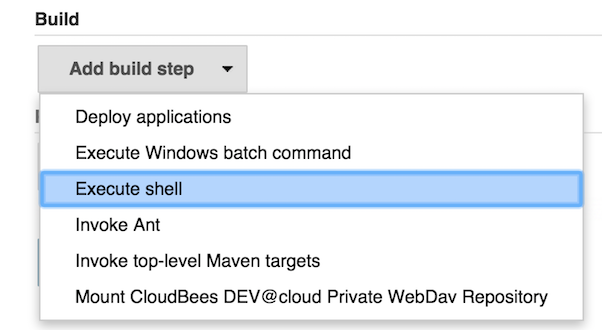
In the Command input box, add the following commands:
export SAUCE_USERNAME="your-sauce-username"
export SAUCE_ACCESS_KEY="your-sauce-access-key"
export APPLITOOLS_API_KEY="your-applitools-api-key"
gem install bundler
bundle install
bundle exec rspec
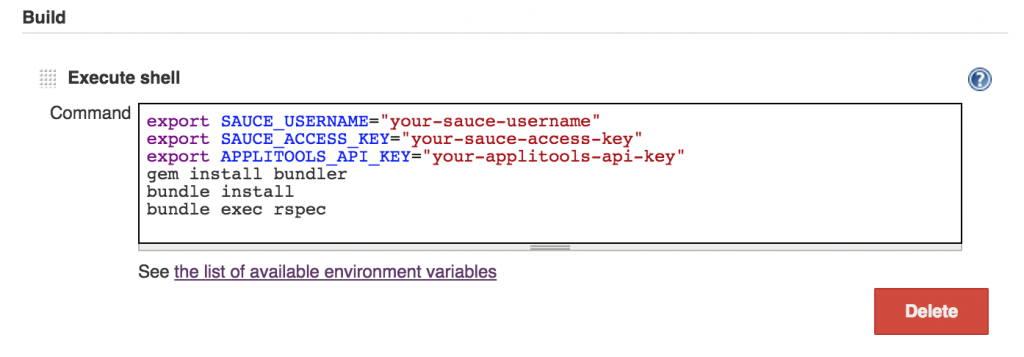
Since our tests have never run on this server we need to include the installation and running of the bundler gem (gem install bundler and bundle install) to download and install the libraries (a.k.a. gems) used in our test suite. And we also need to specify our credentials for Sauce Labs and Applitools Eyes (unless you decided to hard-code these values in your test already – if so, then you don’t need to specify them here).
5. Run Tests & View The Results
Now we’re ready to save, run our tests, and view the job result.
- Click
Save - Click
Build Nowfrom the left-hand side of the screen
When the build completes, the result will be listed on the job’s home screen under Build History.
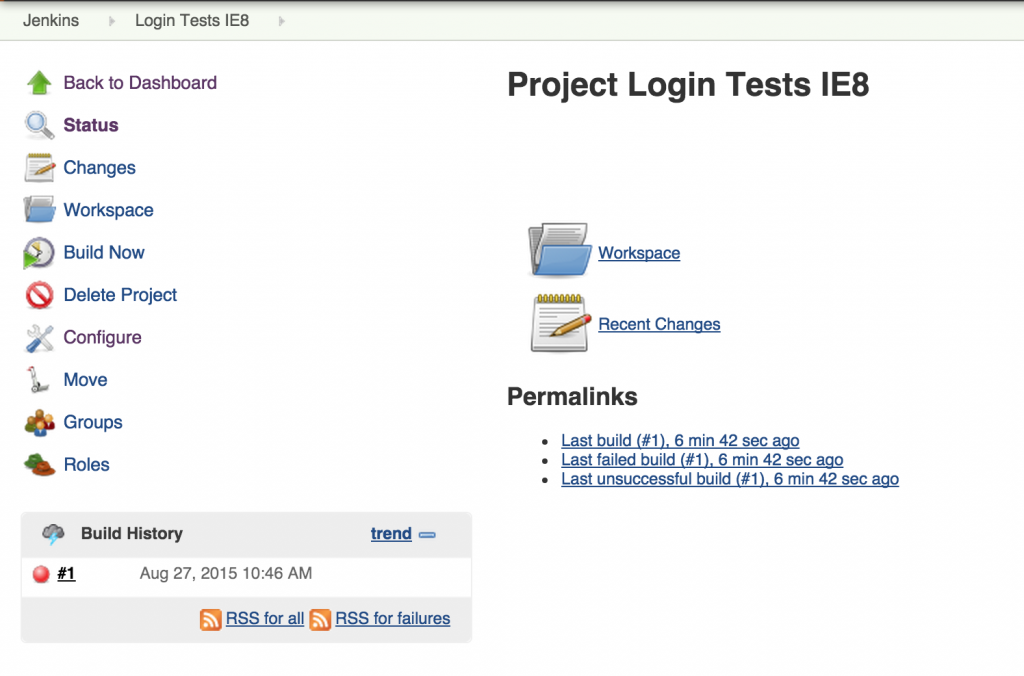
You can drill into the job to see what was happening behind the scenes. To do that click on the build from Build History and select Console Output (from the left navigation). This output will be your best bet in tracking down an unexpected result.
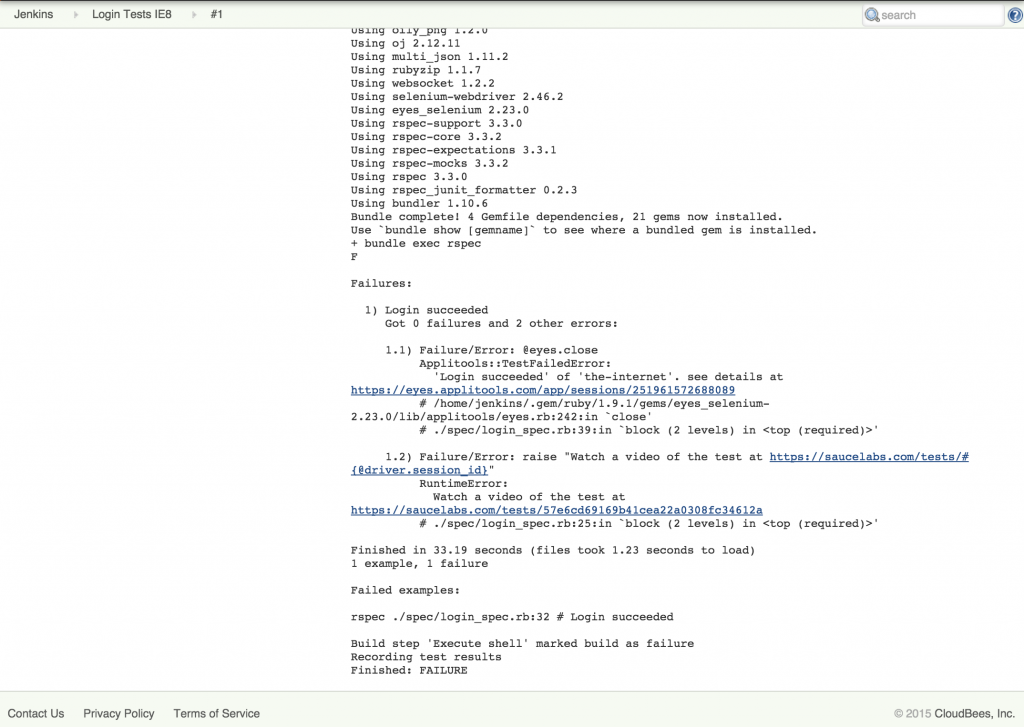
In this case, we can see that there was a failure. If we follow the URLs provided, we can see a video replay of the test in Sauce Labs (link) and a diff image in Applitools Eyes.
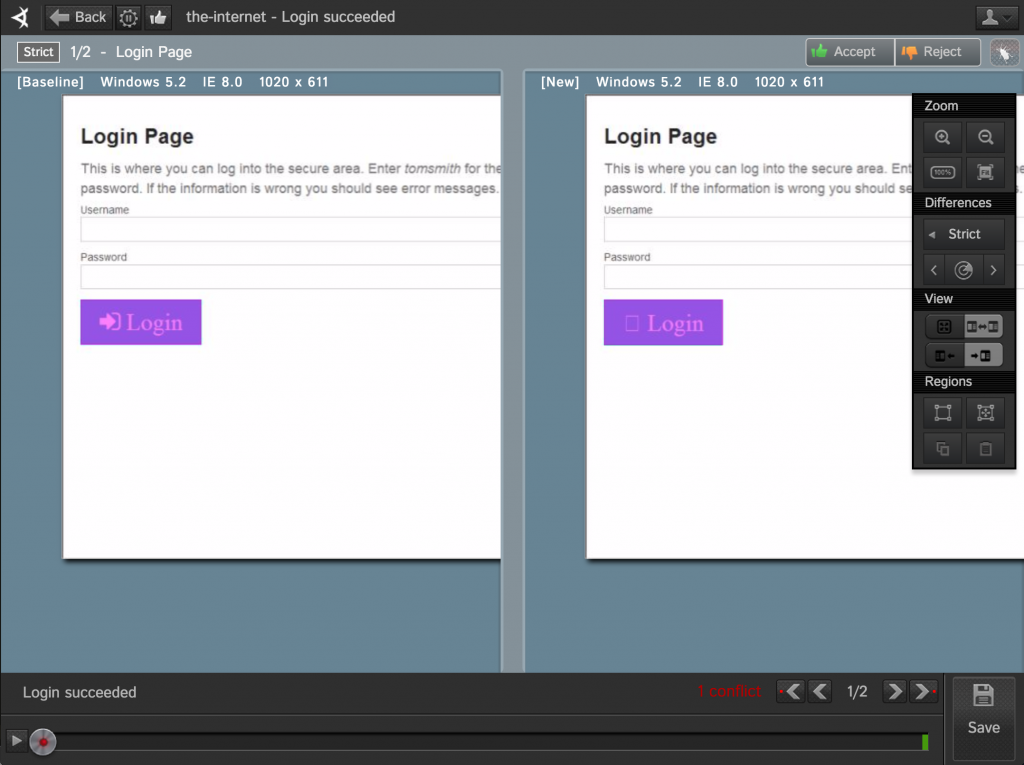
The culprit for the failure here wasn’t a failure of functionality, but a visual defect with the image on the Login button.
A Small Bit of Cleanup
Before we can call our setup complete, we’ll want a better failure report for our test job. That way when there’s a failure we won’t have to sift through the console output for info. Instead we should get it all in a formatted report. For that, we’ll turn to JUnit XML (a standard format that CI servers support).
This functionality doesn’t come built into RSpec, but it’s simple enough to add through the use of another gem. There are plenty to choose from with RSpec, but we’ll go with rspec_junit_formatter.
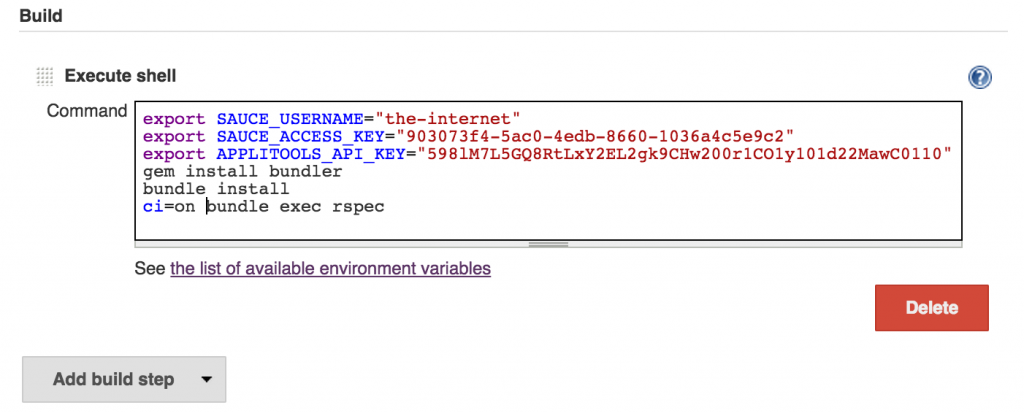
After we install the gem we need to specify some extra command-line arguments when running our tests. A formatter type (e.g., --format RspecJunitFormatter) and an output file for the XML (e.g., --out results.xml). And since this type of output is really only useful when running on our CI server, we’ll want an easy way to turn it on and off.
# filename: .rspec

<% if ENV['ci'] == 'on' %>
--format RspecJunitFormatter
--out tmp/result.xml
<% end %>
Within RSpec comes the ability to specify command line arguments that are used frequently in a file (e.g., .rspec) that lives in the root of the test directory. In it we specify the new commands we want to use and wrap them in a conditional that checks an environment variable that denotes whether or not the tests are being run on a CI server (e.g., if ENV['ci'] == 'on').
Now it’s a small matter of updating our Jenkins job to consume this new JUnit XML output file by adding a post-build action to publish it as a report.
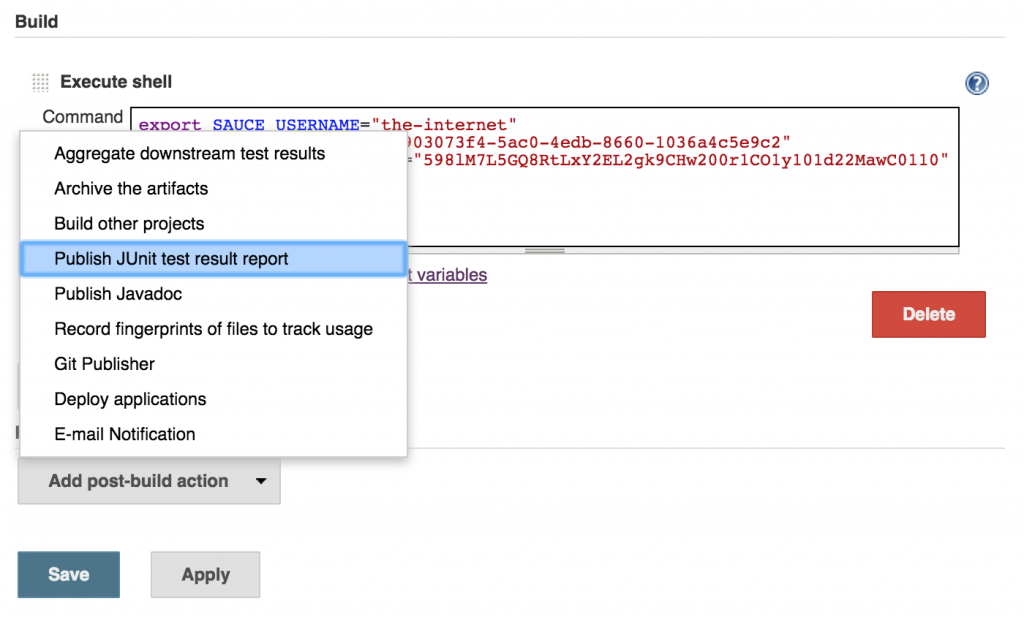
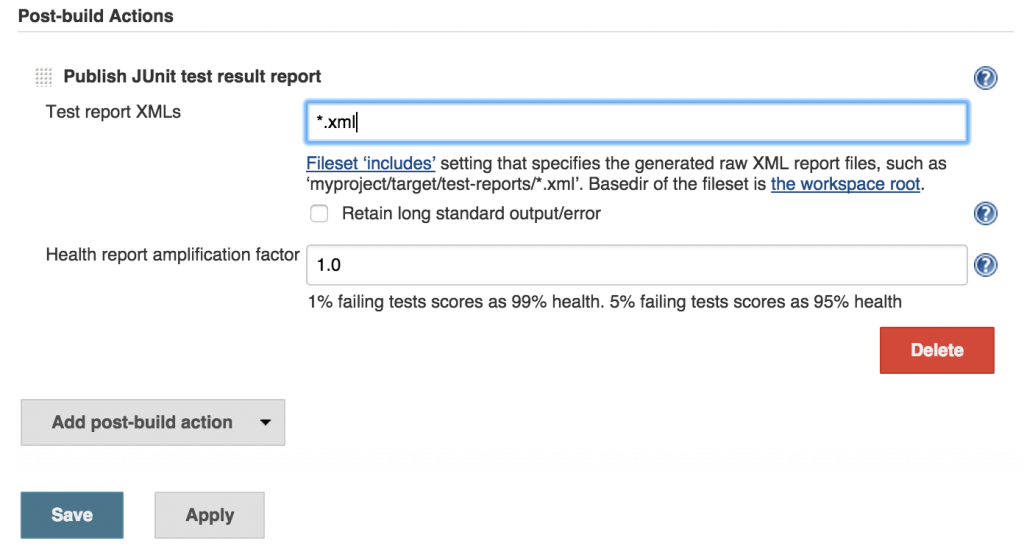
Then we need to tell the Jenkins job where the XML file is. Since it ends up in the root of the test directory, we can just specify the file extension with a wildcard.
Lastly, we need to update the shell commands for the build to set the ci environment variable to on.
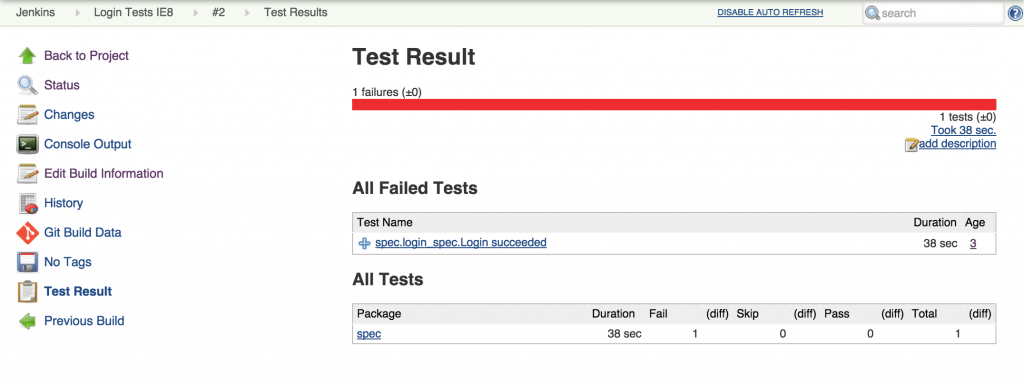
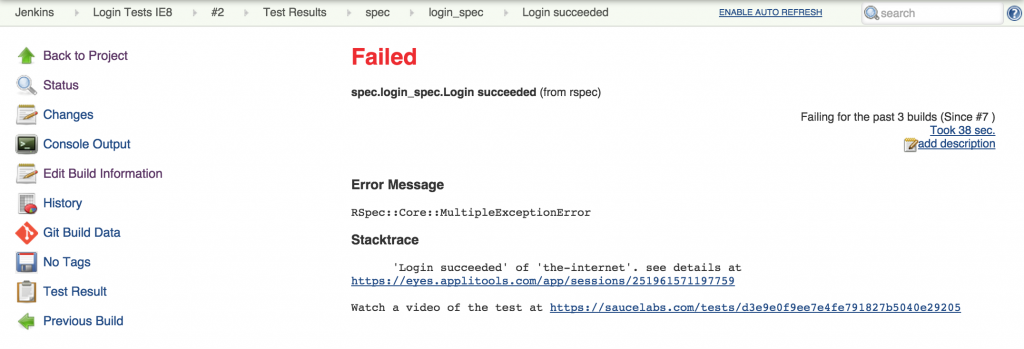
Now when we run our test, we’ll get a test report which states which test failed. And when we drill into it, we get the URLs for the jobs in Sauce Labs and Applitools Eyes.
One More Thing: Notifications
In order to maximize your CI effectiveness, you’ll want to send out notifications to alert your team members when there’s a failure.
There are numerous ways to go about this (e.g., e-mail, chat, text, co-located visual cues, etc). And thankfully there are numerous, freely available plugins that can help facilitate whichever method you want. You can find out more about Jenkins’ plugins here.
For instance, if you wanted to use chat notifications and you use a service like HipChat or Slack, you would do a plugin search and find one of the following plugins:


After installing the plugin for your chat service, you will need to provide the necessary information to configure it (e.g., an authorization token, the channel/chat room where you want notifications to go, what kinds of notifications you want sent, etc.) and then add it as a Post-build Action to your job (or jobs).
Now when your CI job runs and fails, a notification will be sent to the chat room you configured.
Outro
If you’ve been following along through this whole series, then you should now have a test that leverages Selenium fundamentals, that performs visual checks (thanks to Applitools Eyes), which is running on whatever browser/operating system combinations you care about (thanks to Sauce Labs), and running on a CI server with notifications being sent to you and your team (thanks to CloudBees).
This is a powerful combination that will help you find unexpected bugs (thanks to the automated visual checks) and act as a means of collaboration for you and your team.
And by using a CI Server you’re able to put your tests to work by using computers for what they’re good at – automation. This frees you up to focus on more important things. But keep in mind that there are numerous ways to configure your CI server. Be sure to tune it to what works best for you and your team. It’s well worth the effort.
To read more about Applitools’ visual UI testing and Application Visual Management (AVM) solutions, check out the resources section on the Applitools website. To get started with Applitools, request a demo or sign up for a free Applitools account.


