I have been using Cypress for almost three years now and given different talks ranging from an introduction to Cypress, how to use Cypress for API testing, how to handle iframes and how to leverage Cypress beyond functional testing. Cypress has been releasing a constant flow of new features and changes and sometimes it can be hard to keep up. In this blog post, I want to share with you some of my favorite Cypress features and some tips or advice that you might find useful.
Cypress Test Runner
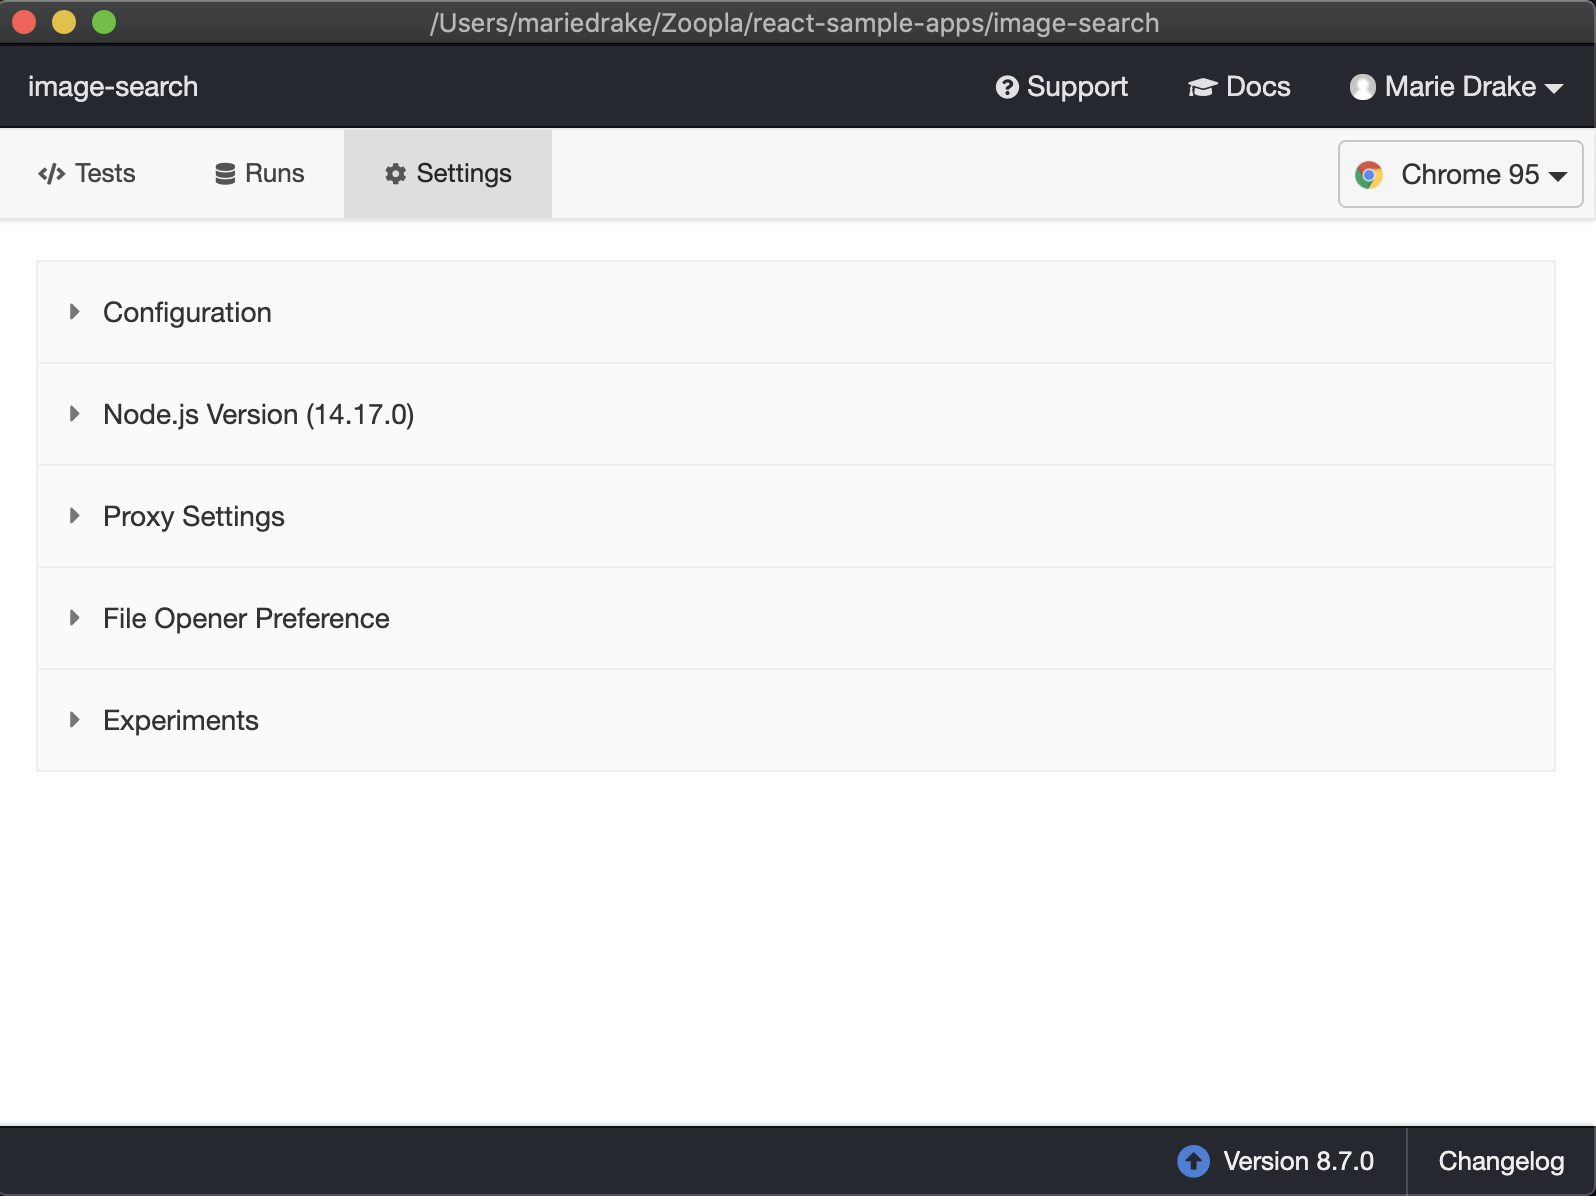
My first favorite feature is simply the Cypress Test Runner itself. I’m a visual type of person and when running tests, I learn more about the application if I can see how it works visually. From the Cypress Test Runner, you can see all your test files, search and even create a new test file from scratch. You can also see which browsers are available for you to run your tests on locally and the great thing is you can easily switch to these browsers without having to restart the test runner. It also gives you information about which version of Cypress you’re using and of course a link to their changelog as seen from the screenshot below.
When you select a file to run, it displays all the tests you have written on that file and when tests are running, you also have a preview of your test application.
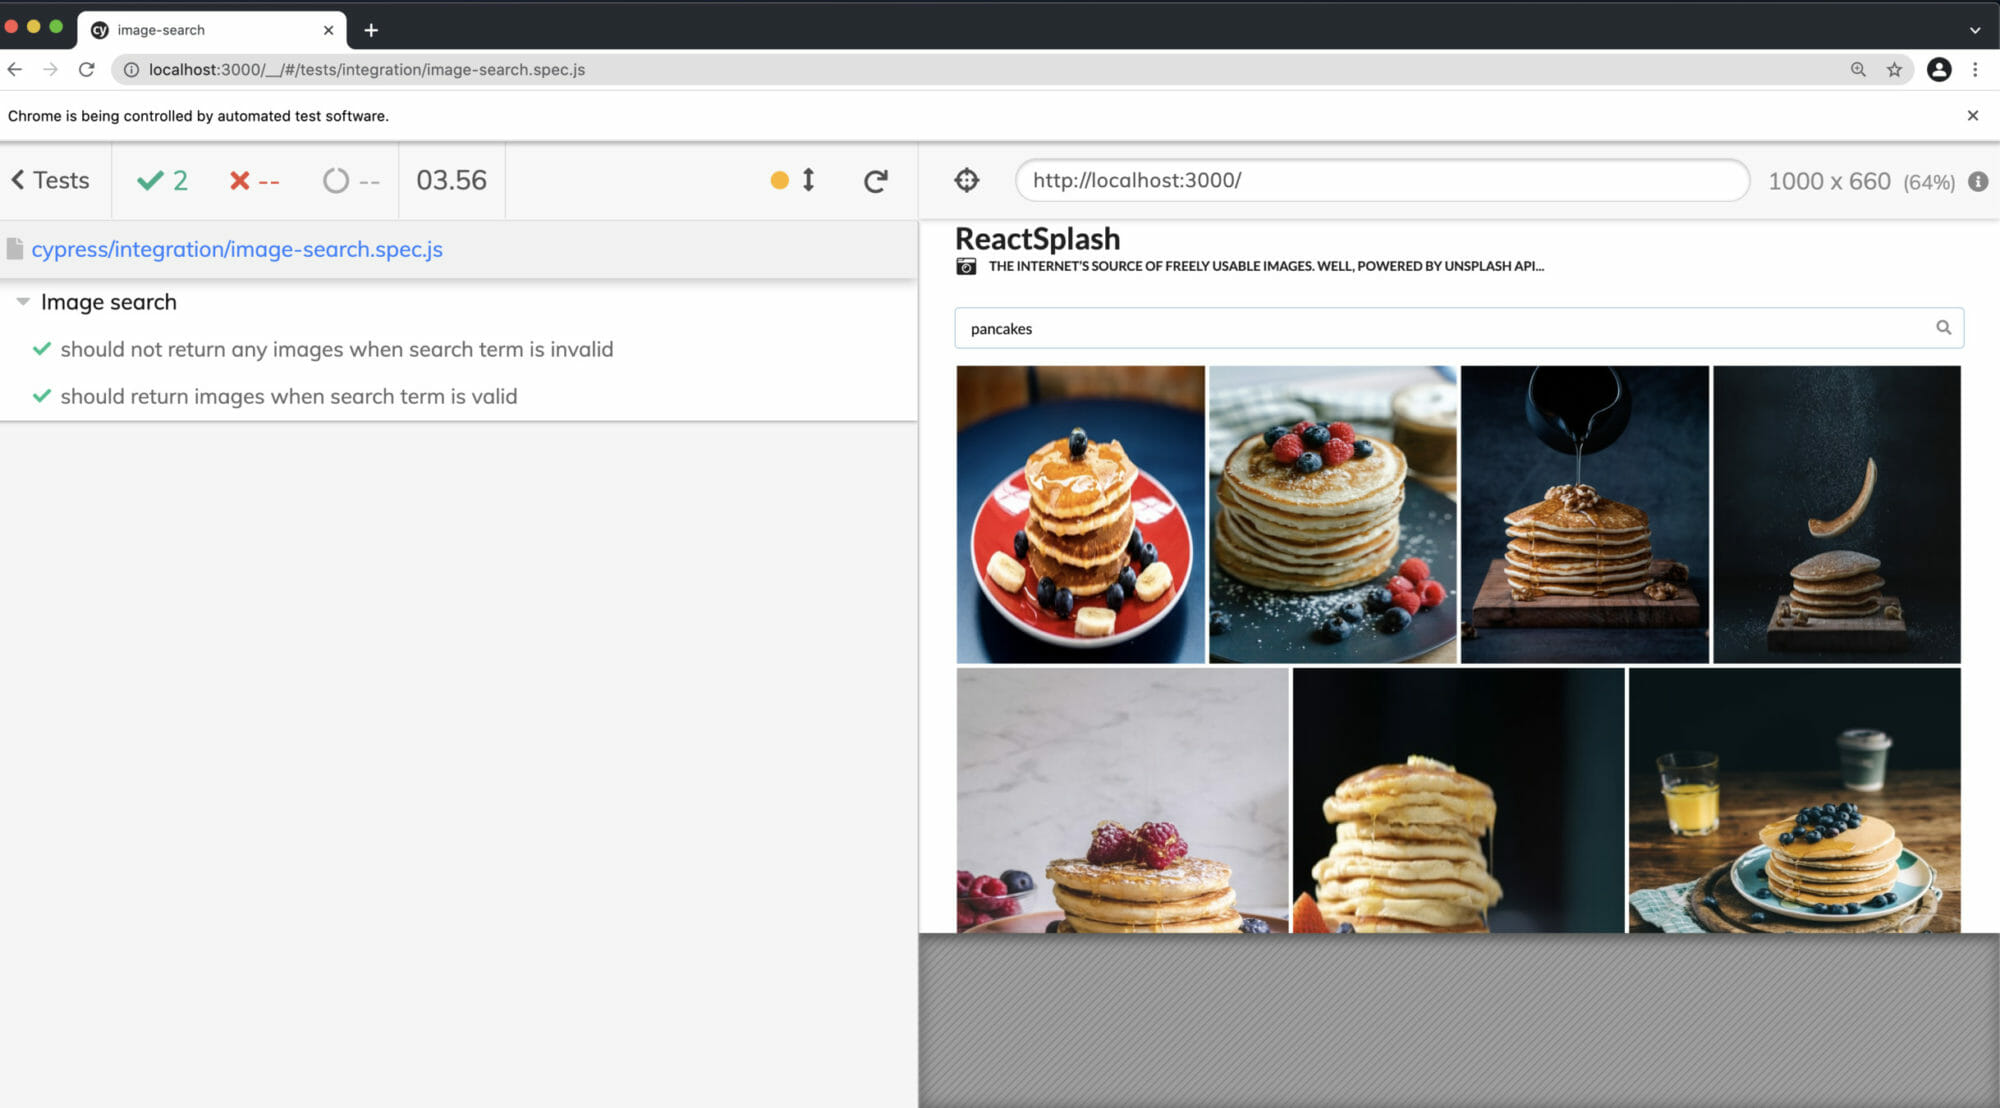
What I particularly like about the test runner is that every time you make code changes to your tests, Cypress will automatically re-run your tests without you having to relaunch the test runner.
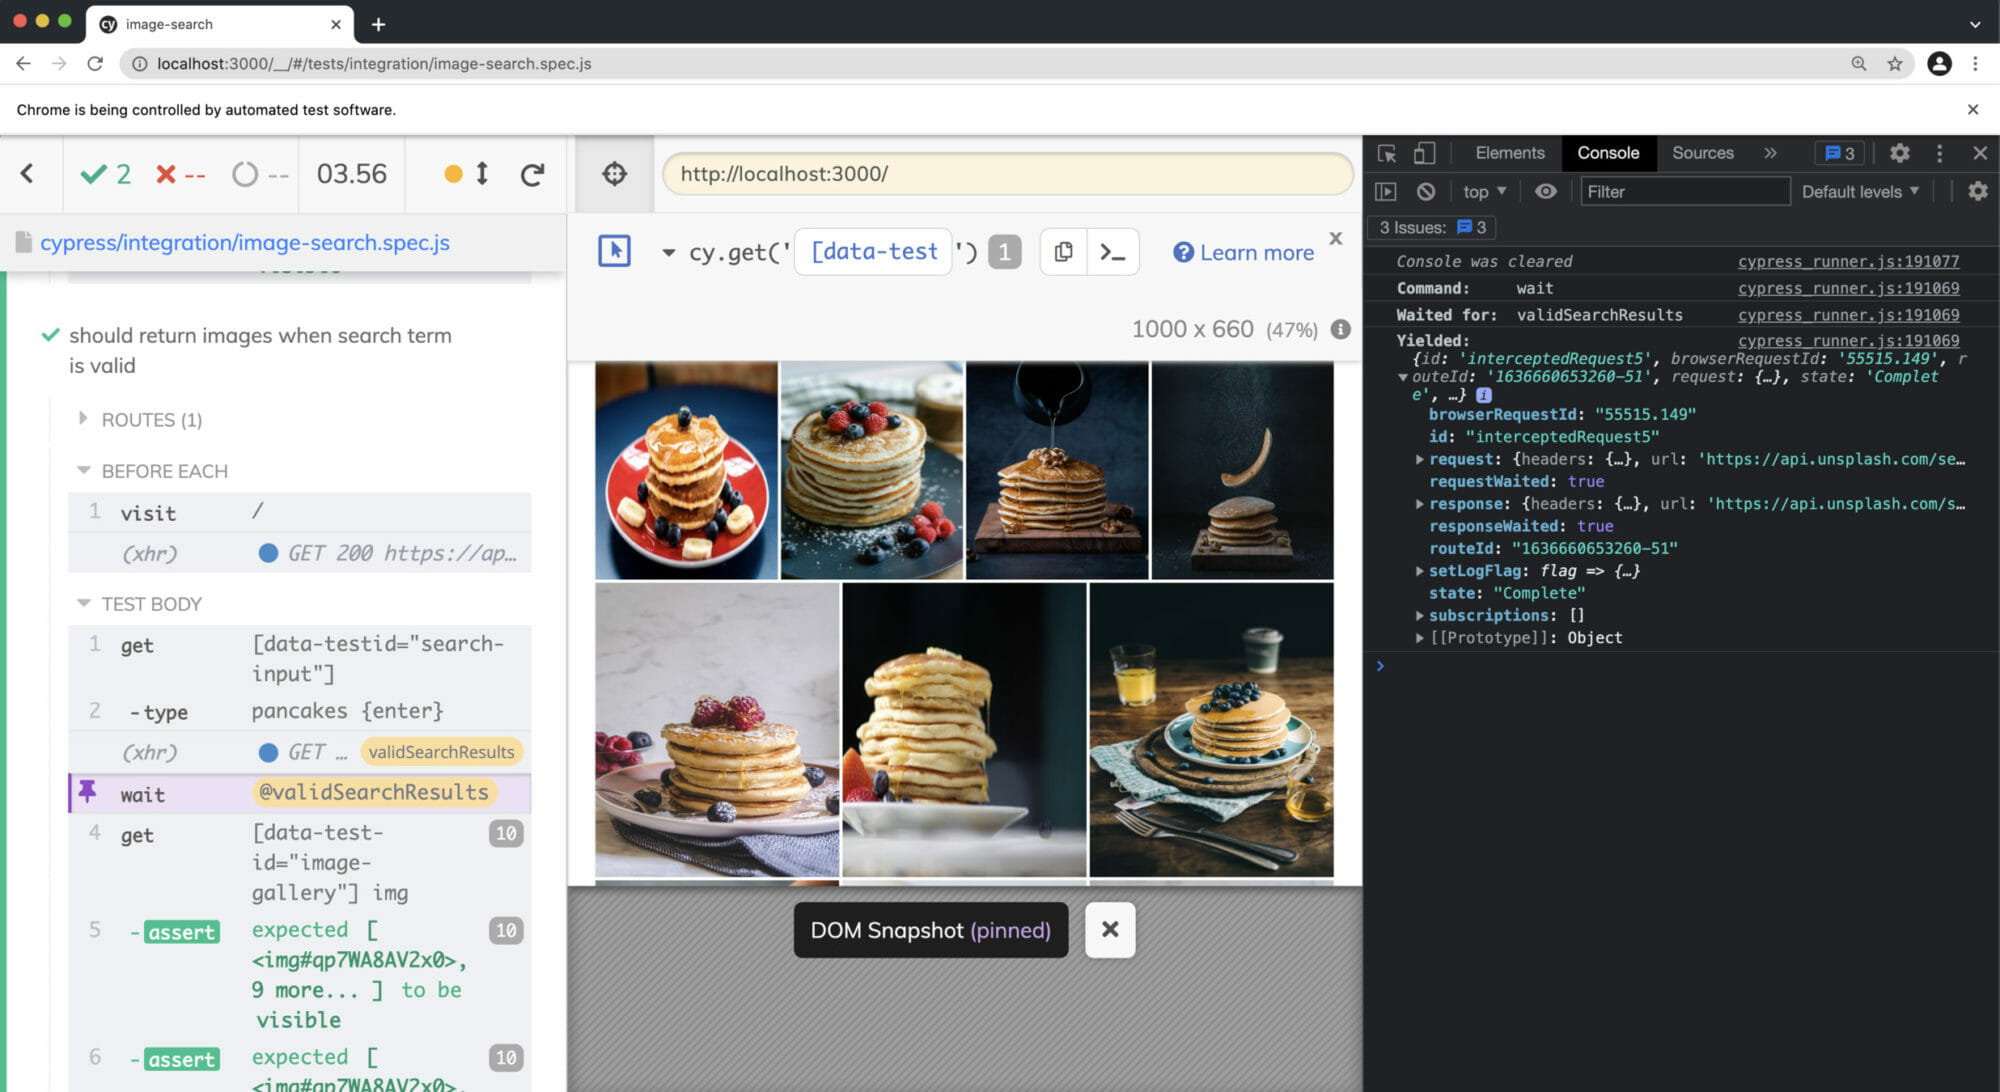
When you right click on the Cypress Test Runner, you have access to Developer Tools which makes it easier to debug your tests. Clicking on a test command will also print additional logs relating to the command on the console.
Handling Network Requests
Moving on to my second favorite feature and this is Cypress’ ability to handle network requests. Cypress has built in methods to intercept network requests so you can spy for network calls and wait for it to finish before performing other actions. On previous versions, Cypress can only intercept xhr calls but with their new and powerful cy.intercept() command, this can intercept all types of network requests including fetch calls.
If you want to match all requests by default whether it’s a GET or POST request, by default you just have to pass in the url that you want to intercept. Here is an example code snippet where I want to intercept all calls to search/photos and my example query parameter.
Now when Cypress detects network calls that match the url, it will be intercepted and you can then do follow up actions such as spying, aliasing the request or modifying any of its request headers and responses.
When you run a test with the intercepted call, you might notice that there is also a filled circular indicator beside the network call as seen on the screenshot below. This indicates that a real request has been made to the server.
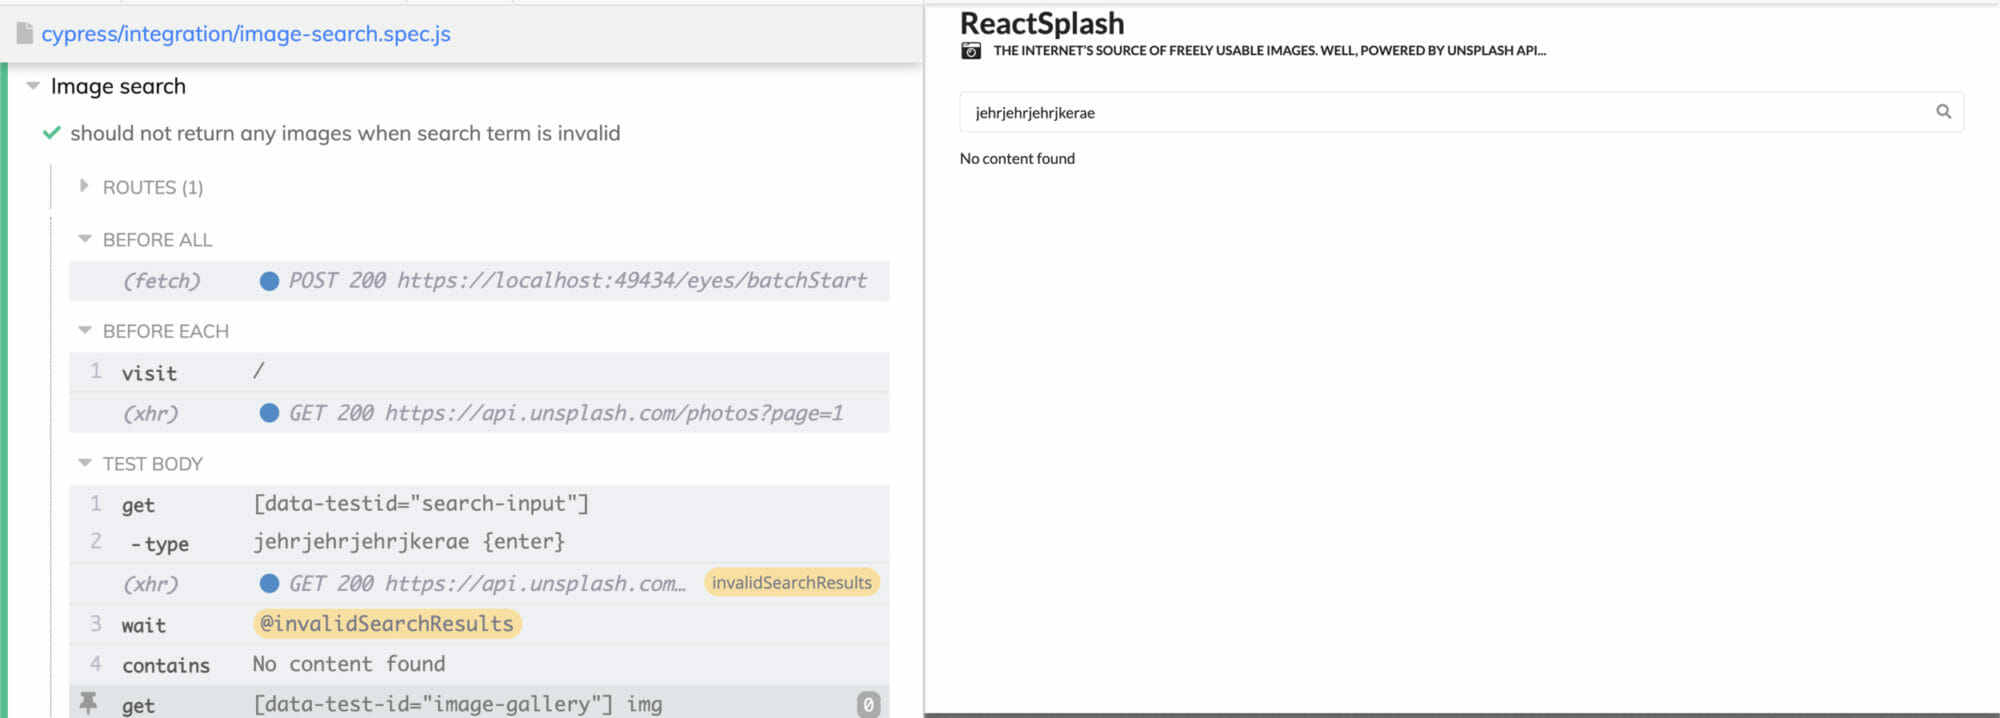
When you intercept any calls, Cypress also creates a routes table which shows any network calls you have intercepted. It shows the matched methods, the route matcher, whether it’s been stubbed or not, any aliases and the number of matched requests.

Stubbing Network Requests
On to my third favorite feature and this is how Cypress can stub the responses of your network calls so you have better control of your tests. This allows you to have stable tests because you’re testing the functionality of your application solely without relying on too many network calls.
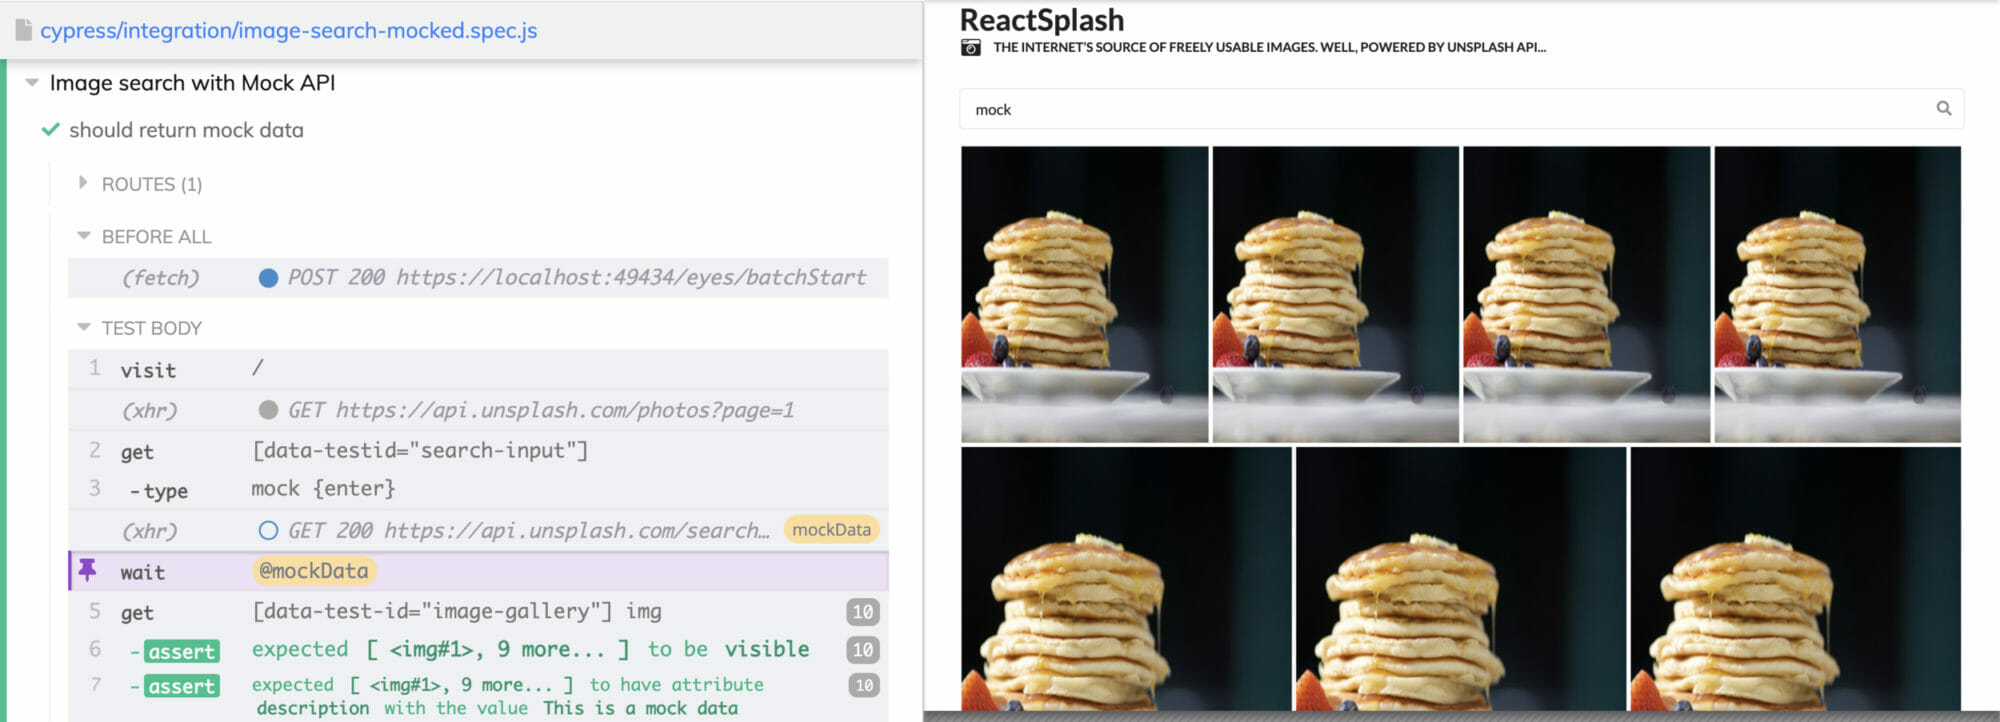
To stub a network call, we use the cy.intercept() command again. Looking at the code snippet below, I am able to pass in the method GET, followed by the route matcher, and using a static json file as my Cypress fixture, which represents the data that I want the API to return.
Now when I run the test, Cypress will stub any GET requests to search/photos?query=mock and you can see from the screenshot below that my search results return the mock data that I have specified. Now, I can be confident that my test will not break even if the API that my application is using has gone offline due to some issues.
You might notice that there is also a circular indicator beside the network call but this time it’s unfilled. If a circular indicator is not filled, it means that the request has been stubbed with a pre-canned response.
Screenshots and Videos
Now, imagine if you have a failing test that’s running in your continuous integration pipelines. The error logs are useful but like I said, I’m a very visual person so I really find the automatic screenshots and videos useful when debugging why my tests are failing.
When you run the command to run your tests headlessly, videos will be generated automatically after each test run. Cypress will then save the videos by default in a folder called cypress/videos.
If you want to make some adjustments, there’s some configuration that you can do with videos in Cypress. If you only want to generate a video when a test has failed, on your cypress.json, you just need to set videoUploadOnPasses to false. If you want to turn off the video feature completely, just simply set video to false as seen from the code snippet below.
Now on the other hand, when you run your tests headlessly and there are tests that are failing, Cypress will only generate screenshots for any tests that have failed. This will then be saved automatically to a folder called cypress/screenshots.
If you don’t want Cypress to take a screenshot when a test fails during cypress run, you can also override the configuration in your cypress.json file by setting screenshotOnRunFailure to have the value false.
As a general tip to everyone, whenever tests fail in a CI pipeline, it’s really useful that screenshots and videos are added as artifacts. It enables all engineers to see why a test has failed rather than relying on Quality Engineers, so if you’re not adding these as artifacts yet to your test runs, then please add it.
If you want to take it a bit further, there is a reporting plugin that you can use called Mochawesome which will generate an HTML report for your Cypress test runs. You can also attach screenshots to the HTML report by doing some additional configuration after each test run and I’ve written a tutorial here for you that you can follow along – Attaching Cypress Screenshots to your Mochawesome Report.
Cypress Code Coverage
Did you know that Cypress can also measure code coverage? While code coverage is not the best measure for checking that we have written a great test nor does it measure that our tests are credible, it does give you a visual indicator to see which areas of our code have been overly tested and which areas have not been tested at all.
Code coverage tools work by scanning your application’s source code and inserting additional counters to different branches, statements, lines and functions. Every time your automated tests hit different areas on the code base, the counters will increment. Once the tests are finished, the total number of hits will then be recorded against the total number of possible hits.
The code coverage plugin can be integrated easily and I have written an in-depth tutorial on how this can be done which you can find here – Generating Code Coverage Report for Cypress.
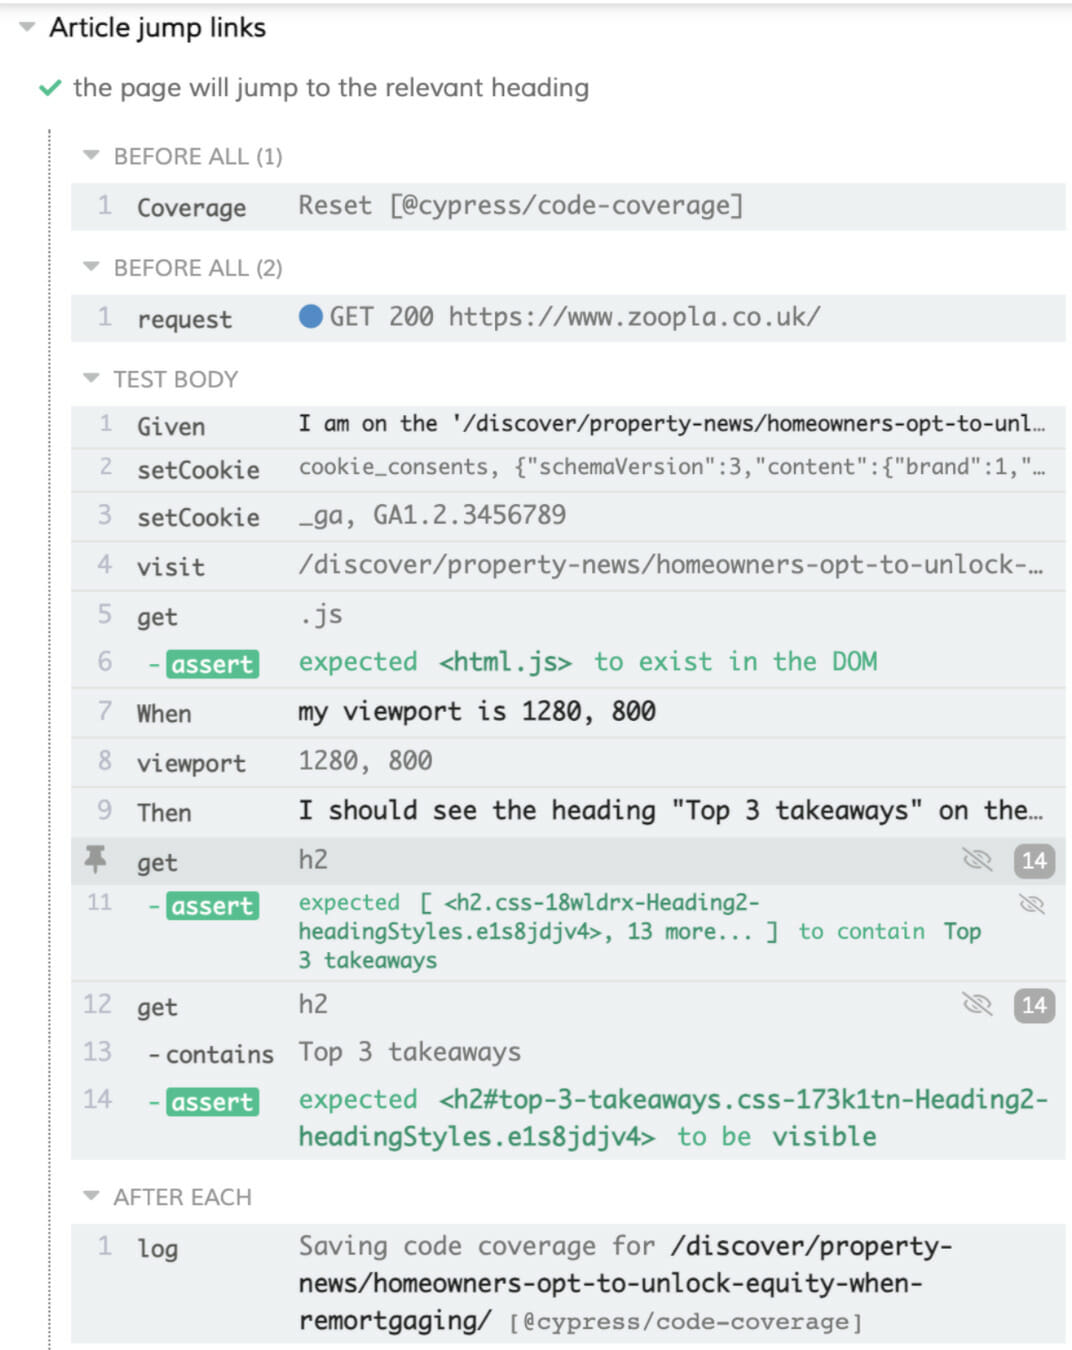
Once the plugin has been installed and your code is instrumented properly, when you load the Cypress Test Runner, you should see additional logs that code coverage is being collected, as seen on the screenshot below.
Cypress Studio
The final feature that’s currently my favorite at the moment is Cypress’s experimental feature called Cypress Studio. Cypress Studio lets you write automated tests with minimal coding by recording your interaction to the application under test. I have written a more extensive post about this which you can find here – Experimenting with Cypress Studio.
Cypress Studio automates most of the steps required to interact with your application such as clicking buttons, typing strings to an input field, checking radio buttons and selecting options from a drop down menu. Apart from these interactions, Cypress Studio also lets you write assertions quickly.
Since this is still an experimental feature, a minimal configuration is required! On your cypress.json, you just need to set the experimentalStudio key to be true. You also need to have installed a later version of Cypress as this was introduced on version 6.3.0.
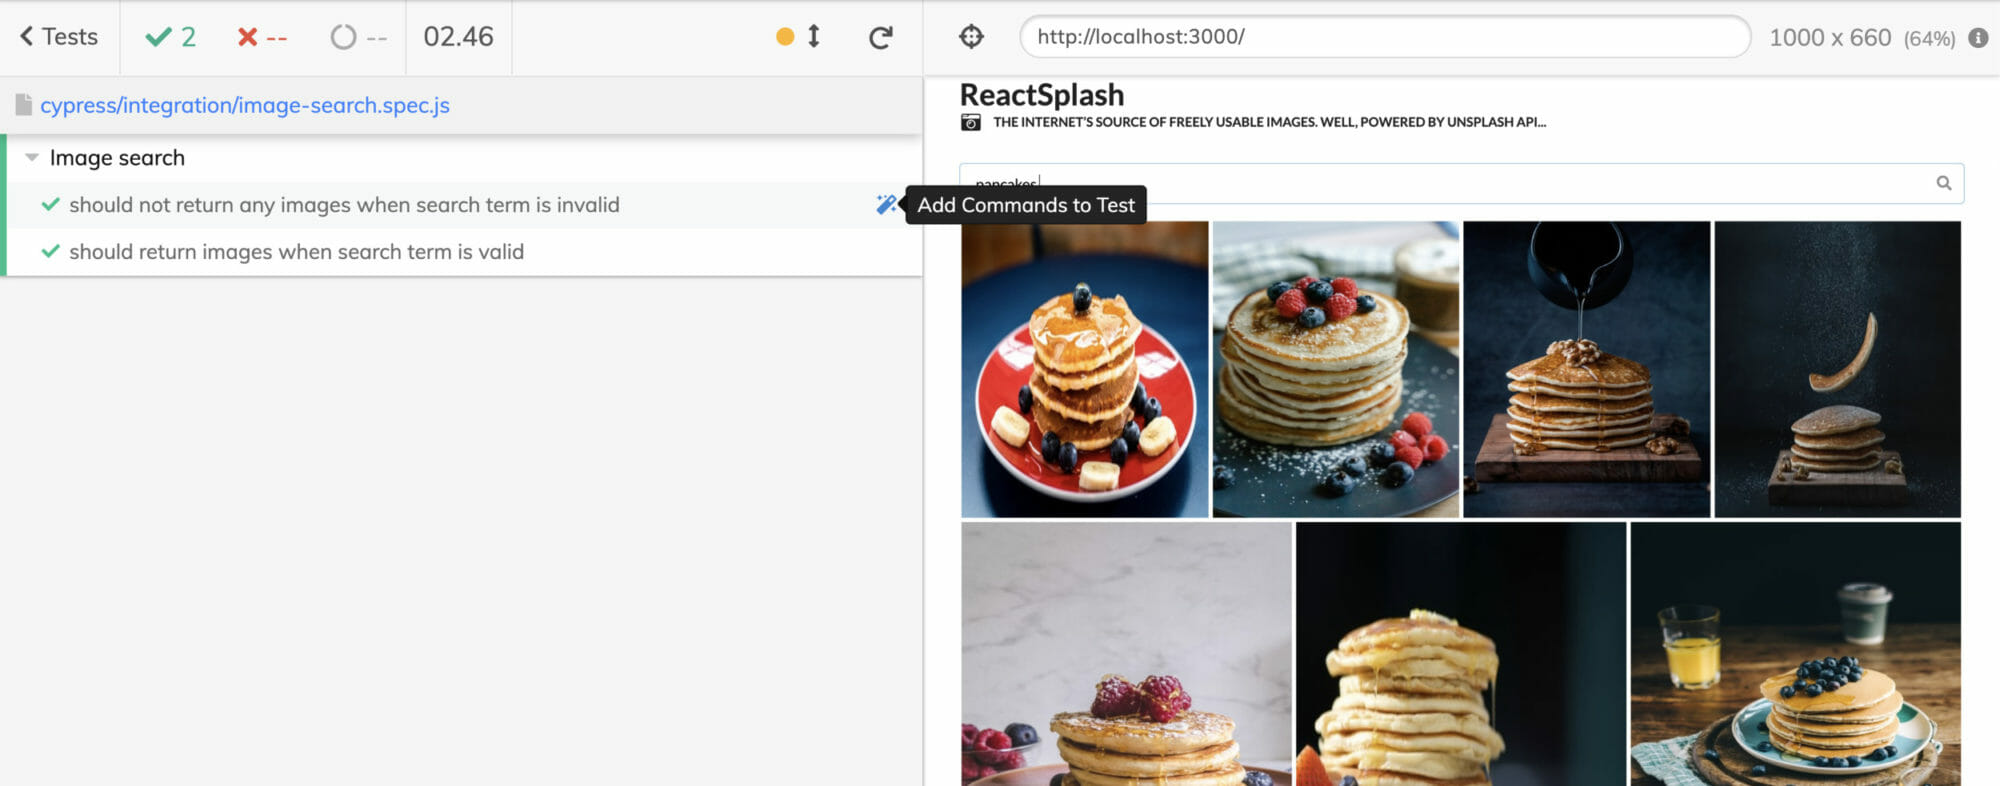
Once the configuration has been added and Cypress Test Runner is launched again, you should see a magic wand icon beside the test name which when clicked, will enable Cypress Studio.
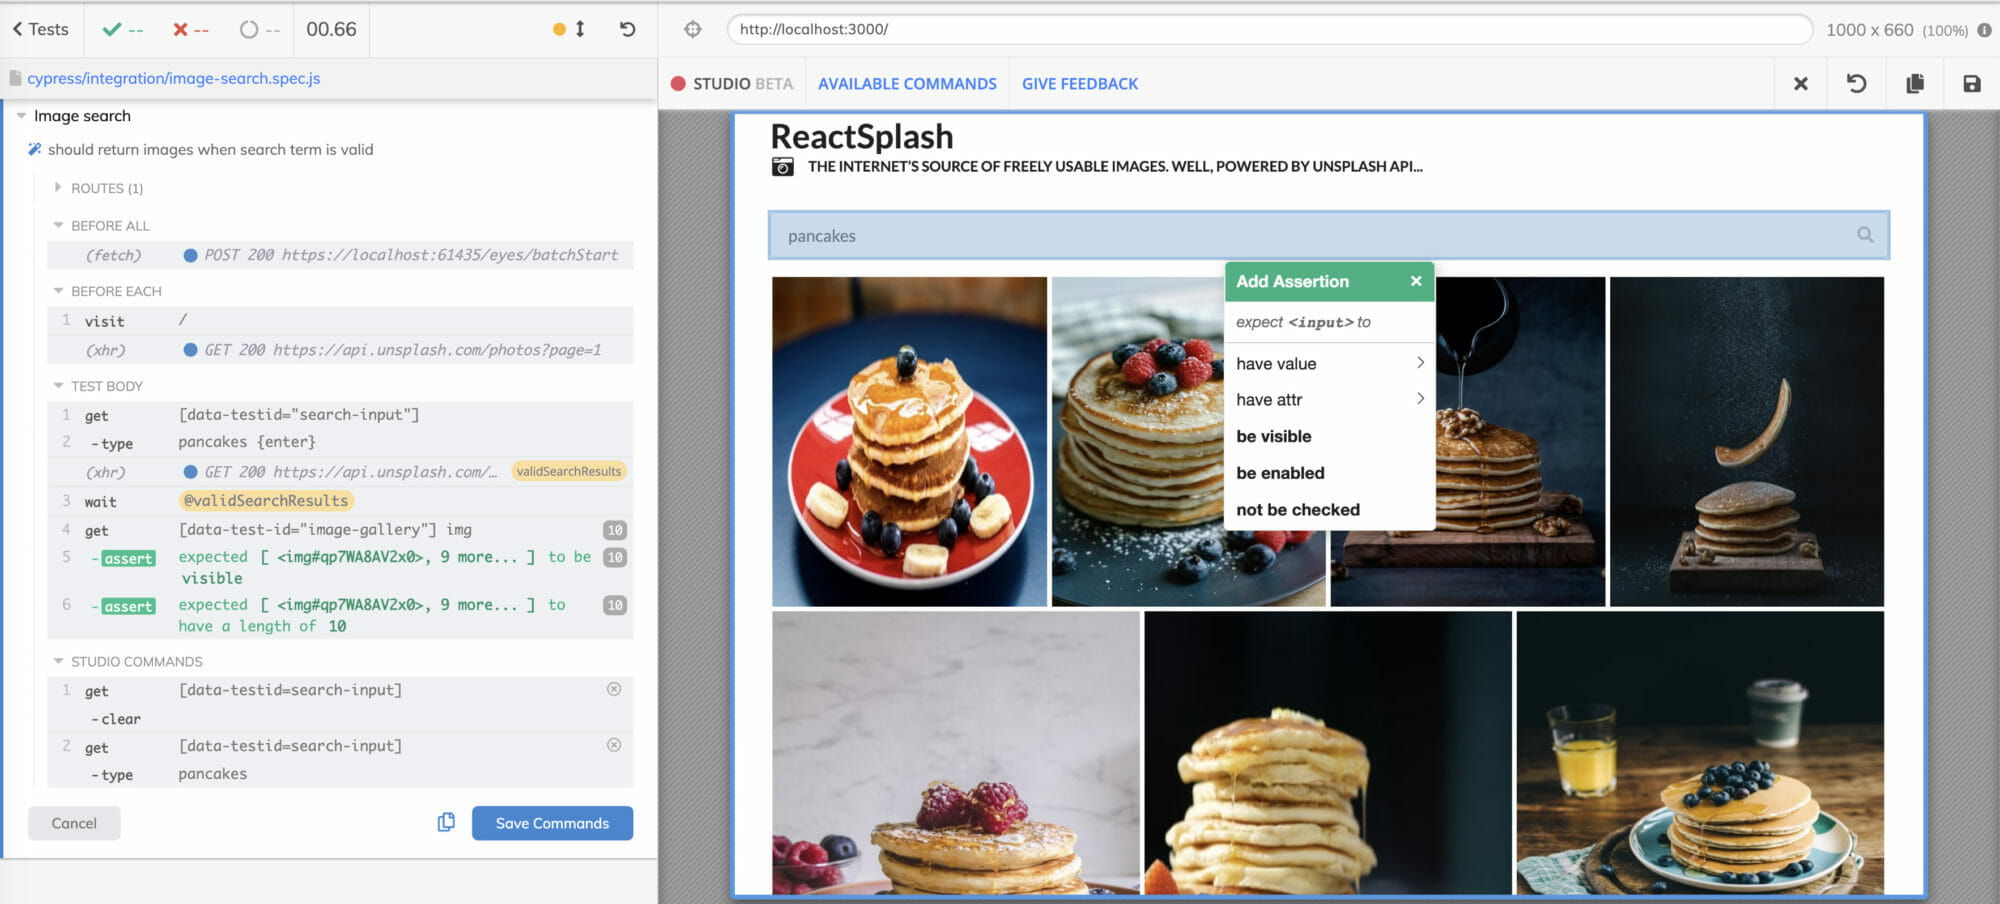
After this, interact with your application just like you would normally do and Cypress will automatically generate the commands. For an example test, imagine that I have clicked the search input, typed some keyword and hit enter. This will then generate a couple of steps on the studio commands which you can save easily into your code editor of choice
If you also want to write assertions quickly, you can also do this by right clicking on the element that you want to assert and then select from the pre-generated assertions that Cypress Studio can detect.
Wrapping Up
Cypress has gained popularity the past couple of years and with new releases, it’s always good to keep ourselves familiar with its changes and features. While this post may not contain an extensive list of features, it’s a good start for learning what Cypress can offer. For further reading, check out Filip Hric’s post on other Cypress plugins that you might find useful – 8 Cypress Plugins You Should Know.


